


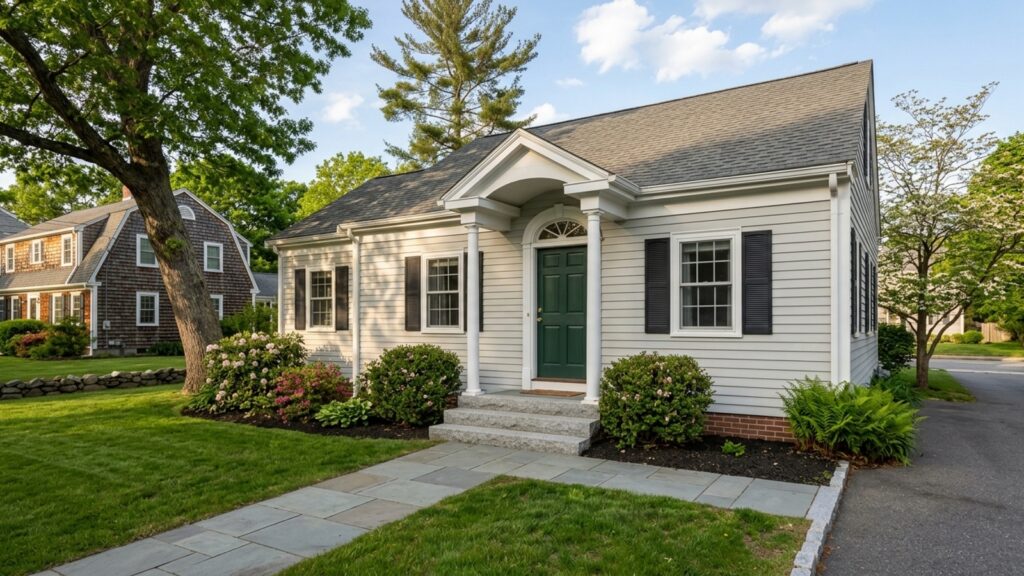
The median home price in Needham, MA sits around $1.7 million right now, with available properties moving in roughly 21 days. If you’re entering this market, you probably want to know what you’re buying into beyond the square footage and the kitchen finishes as you weigh the pros and cons of living in Needham, MA. With about 32,931 residents, Needham is a specific kind of suburban town – close enough to Boston to matter, established enough to feel settled.
What follows is a straight look at the town’s safety data and livability picture, pulled from multiple reporting agencies. No spin. Just what the numbers say.
The Data on Safety in Needham, MA
Needham’s total crime rate runs at roughly 698.6 incidents per 100,000 residents, according to FBI data compiled by HomeSnacks – about 51% below the Massachusetts state average of 1,426.8 per 100,000. That’s a meaningful gap, not a marginal one.
CrimeGrade gives the town an overall grade of A-, placing it in the 83rd percentile for safety nationwide. That means Needham has a lower crime rate than 83% of U.S. cities of a similar size. The component scores break down to an A for violent crime, an A- for property crime, and a B+ for other offenses.
NeighborhoodScout assigns a safety score of 54 out of 100 – which sounds middling until you understand the context. That score means the crime rate is lower than about 49% of all Massachusetts communities, but the town ranks considerably higher when you’re only comparing it to cities with similar populations nationally. In a 2019 analysis, NeighborhoodScout named Needham the 22nd safest community in the U.S. among cities with more than 25,000 residents.
Violent and Property Crime Rates
CrimeGrade’s most recent data puts the violent crime rate at 1.602 per 1,000 residents, broken down into assault (0.8164), robbery (0.2268), rape (0.5393), and murder (0.0194). NeighborhoodScout’s 2021 analysis came in lower, reporting a violent crime rate of 0.52 per 1,000 residents. The two sources use different methodologies, so the spread is worth knowing about rather than ignoring.
For property crime, CrimeGrade reports a rate of 7.902 per 1,000 residents in a typical year. NeighborhoodScout’s 2021 data tracks 6.47 incidents per 1,000 residents. Both figures keep Needham well below state averages for property-related offenses.
Recent Crime Trends
Year-over-year trends show some variation depending on which source you’re reading. City-Data reported a 5% rise in the town’s crime rate in 2023 compared to 2022 and noted an upward trend in both violent and property crimes over a five-year window.
AreaVibes recorded a 67.2% year-over-year increase in total crime in its most recent comparison. The same source also points out that property crime rates per 100,000 residents have declined about 50% since 1990 – so the long-term arc runs in a different direction than the short-term noise.
Public Safety and Emergency Services
The Needham Police Department handles local law enforcement and emergency response across the municipality. As of 2023, City-Data reported approximately 1.58 sworn police officers per 1,000 residents patrolling the town and managing day-to-day public safety operations.
Residents access standard emergency dispatch for police, fire, and medical situations. The town’s emergency infrastructure is sized for a population of roughly 33,000 people. If you’re comparing properties in different parts of town, it’s worth understanding how emergency access plays out block by block – that’s a practical question, not a theoretical one.
Recreation and Quality of Life
Rosemary Lake comes up a lot when buyers ask about outdoor options in Needham. It’s one of the town’s more recognizable landmarks and serves as a focal point for outdoor activity and community events. You’ll want to check directly with local municipal departments for current access guidelines and seasonal schedules for public water bodies – those details change.
Needham has a suburban layout with established commute routes into Boston and surrounding employment centers. With roughly 60 homes currently on the market, you have options near different recreational facilities depending on where your priorities land.
Market Conditions and Livability
About 36% of recent home sales in Needham closed above asking price. That tells you something useful about where buyers’ heads are when they get to the offer stage. Inventory sits around 1.6 months of supply, which means if you find something that works, you should have your financing ready before you go looking – not while you’re looking.
School districts and property taxes are worth reviewing carefully as you build your budget. The full cost of living in a town like this doesn’t stop at the purchase price.
Frequently Asked Questions
Is Needham, MA safe?
Yes. Needham’s overall crime rate is lower than the Massachusetts average. HomeSnacks reports the total crime rate is about 51% below the state average, and CrimeGrade gives the town an A- overall safety rating.
What is the crime rate in Needham, MA?
The total crime rate is roughly 698.6 per 100,000 residents based on FBI data compiled by HomeSnacks. That breaks down to a violent crime rate of about 1.602 per 1,000 residents and a property crime rate of 7.902 per 1,000 residents, according to CrimeGrade.
How does Needham’s crime rate compare to the Massachusetts and national average?
Needham ranks safer than the Massachusetts state average across overall, violent, and property crime categories. Nationally, CrimeGrade places Needham in the 83rd percentile – meaning it has a lower crime rate than 83% of similarly sized U.S. cities.